Introduction and Overview
The purpose of this document is to display the author’s (Jeong Yu Han) contribution to the software engineering module project and his technical skills.
My team and I were tasked with enhancing a command line, desktop application for our Software Engineering project. We chose to morph it into a teaching assistant called the Njoy Teaching Assistant, targeted at tech-savvy teachers who wish to improve the efficiency of their daily tasks such as creating quizzes, schedules, notes and tracking student performances.
This is what our project looks like:
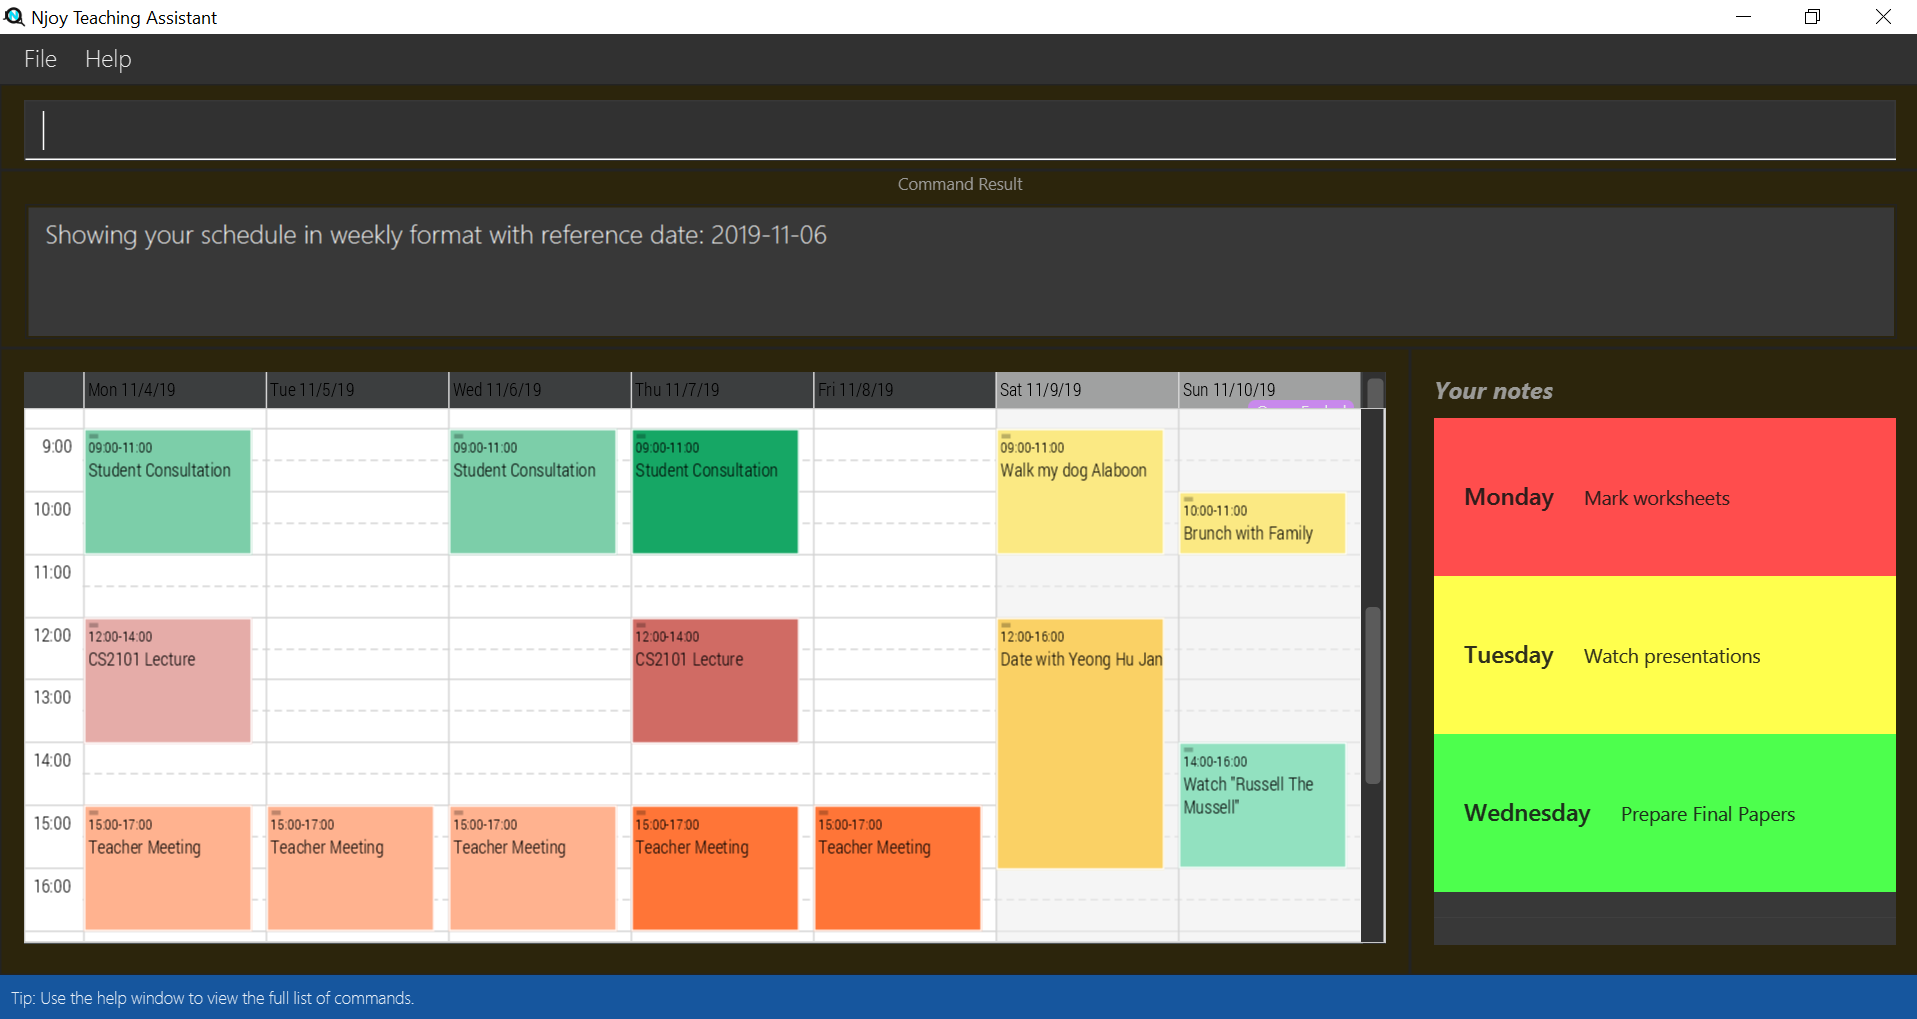
My role was to design and write code for the notes and statistics features. The rest of the sections covers the summary of my contributions to the codebase, user guide and developer guide.
The following are icons and symbols that I will be using for the Project Portfolio:
| This symbol indicates a note to the user. |
This indicates a component, class or object of Njoy or other external softwares.
This indicates important text.
Summary of contributions
This section details a summary of my enhancements, code contributions and other tasks.
I implemented the note commands which include: Creating, Editing, Deleting, Listing and Sorting notes.
Another feature I implemented was the ability to generate and store Statistics reports.
Enhancements
Creating, Editing and Deleting Notes (Major Enhancement)
-
What it does: Users can add notes with a title, description and an optional priority. The default priority is unmarked and different priorities are color coded. The features can be edited/deleted by specifying their index and the fields to edit.
-
Justification: Teachers often have a dizzying array of tasks to handle. The notes feature allows teachers to deal with work and other worries, allowing them to handle the most pressing issues. Editing and deleting gives the flexibility of shifting priorities, typing errors and task completion.
-
Highlights: The implementation for this feature required contemplation in terms of UX. While additional features such as re/un-doing was considered, the main principle of the notes UX is to be lightweight and easy to use. I decided to give the simplest set of commands while making prioritising optional. Validation for the input command was also challenging, in particular for the edit command.
Sorting Notes
-
What it does: Users can sort the notes in the list in descending order of priority.
-
Justification: Users should be easily able to identify more pressing tasks.
Listing Notes
-
What it does: Users can show the list of notes in the command result box. This feature is an alternative solution to the issue of notes having content length that exceed its allocated space in the User Interface.
Generating and Storing Statistics (Major Enhancement)
-
What it does: Users can pass student score data from an excel file for processing to generate some descriptive statistics on performance. Store as optionally specified image file.
-
Justification: Give teachers the ability to see class performance at a glance and identify weaker students to help.
-
Highlights: The implementation for this feature required contemplation on the decision of storing and rendering formats for the report.
Code contributed
Please click the following link to see my code contributions dashboard. Code Report
Other contributions
-
Project management:
-
Reviewed team’s code coverage, resolved issues in the tracker, update project Ui.png.
-
-
Enhancements to personal and team documentation:
-
Enhancements to team code:
-
Wrote logging for majority of the team’s parsers: #219
-
Wrote the skeleton for storage using the Student entity : #47
-
Wrote the skeleton for the generic printable interface for print/export functions : #105
-
Refactor poor practices to follow better scalability and readability : #91
-
Wrote additional tests and generic model stubs for testing : #123
-
-
Community:
-
Tools:
-
Change team’s dependencies to be compatible with both Mac and Windows.
-
Contributions to the User Guide
Given below are sections I contributed to the User Guide. They showcase my ability to write comprehensive documentation targeting end-users. I have decided to select one command for each feature as a representation of my abilities. The full document can be seen here: User Guide |
The following is an example of Creating Notes:
Creating a note
Create lightweight, digital notes and reminders quickly and easily as specified.
Format: note note/… desc/… priority/… (optional)
The options supported by this feature includes:
-
note- The note title. -
desc- The description of the note. -
priority(optional)- The level of priority placed on this note. It can be of typeunmarked,low,mediumorhigh. It is by default set to unmarked if field is omitted.
| All non-optional fields are required and also cannot consist exclusively of whitespace characters. All leading and trailing whitespaces of the fields will be ignored. |
All priority fields can be in either lowercase or UPPERCASE. (e.g. note note/sample title desc/sample desc priority/low is the same as e.g. note note/sample title desc/sample desc priority/LOW).
|
priority levels are distinguishable by their colour in the User Interface. unmarked or default notes have grey panels, while low, medium and high priority notes have green, yellow and red panels respectively.
|
| The notes panel is not responsive. The User Interface only supports title and description of limited length. Notes that exceed this length will be truncated. For information on how to view these notes, see the note list command. |
Examples:
-
Unmarked Note:
note note/Friday morning class 6A desc/give back prelim papers
Creates an unmarked note with title 'Friday morning class 6A' and description 'give back prelim papers'. -
High priority note:
note note/Tuesday 1pm desc/Science Conference priority/high
Creates a high priority note with title 'Tuesday 1pm' and description 'Science Conference'.
The following is an example of Statistics Generation:
Generating a Statistics report
Create statistics reports of student scores using excel data files. The statistics generated is based
on the calculated weighted score of the input data.
Format: statistics file/… print/…(optional)
The options supported by this feature includes:
-
file- The absolute/relative file path of the data file. -
print(optional)- The filename of the printable report you wish to generate.
| The statistics feature only supports file type in the ‘Excel’ format. Data files are to end with the ’.xlsx’ extension. |
The print option allows the generation of a '.png' file containing a snapshot of the statistics report generated. Regardless of the print specifications, a new window is opened with the statistics report.
|
Printable statistics reports if specified are stored in the same place as where the JAR file is installed. The report can be found under a newly created printable directory. If the directory exists beforehand, no new directory is created.
|
| Filenames without `.png` extension will automatically have the extension appended to the end of the file name. |
| If the file name specified already exists in the printable directory, it will overwrite the existing file. |
Examples:
-
View Statistics Report (without saving):
statistics file/C:\Users\SampleUser\Desktop\6B Prelim Scores.xlsx
Shows the statistics report for excel file named ’6B Prelim Scores’. -
View and Save Statistics Report:
statistics file/C:\Users\SampleUser\Desktop\6B Prelim Scores.xlsx print/6B Prelim Performance Report
Shows the statistics report for excel file named ’6B Prelim Scores’. It also saves an image file containing a snapshot of the statistics report in the ’printable’ directory with name ’6B Prelim Performance Report’.
Data File Specifications
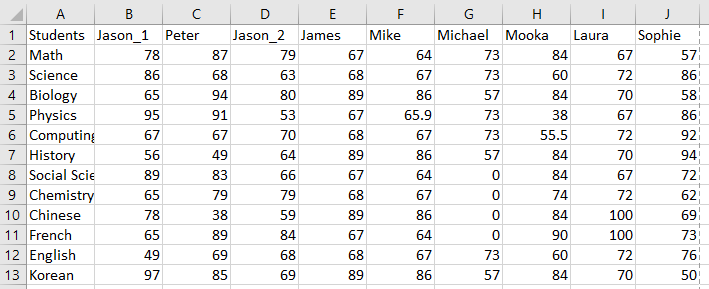
The data file needs to be specified in the following format to ensure that the statistics report is successfully generated.
| Failure to adhere to the following specifications might result in either the excel file being rejected or erroneous statistics. If the report is generated, it might be correct but the behavior is not guaranteed should the specifications mentioned below be violated or overlooked. |
-
Entries start at cell A1 with the cell
Students, regardless of whether there is score data. -
First row begins with the cell
Students, followed by their names. (e.g. row 1 of 4 cells havingStudents,Jason,MikeandPeter) -
First column states the different subjects starting from the second topmost cell. (e.g column 1 of 4 cells having
Students,Math,ScienceandEnglish.) -
There is at least one student.
-
There is at least one subject.
-
All student names have unique identifiers. (e.g. two students named Jason could be identified as
Jason 1andJason 2) -
All subject names have unique identifiers. (e.g. two subjects named Math could be identified as
Advanced MathandElementary Math) -
All students have a corresponding score for all subjects
-
All scores are numeric characters (integer or decimals)
-
There are no gaps between rows and columns.
-
All cells within the row and column range have at least one non-whitespace character.
-
All cells outside the row and column range are empty.
| Failure to adhere to the following specifications might result in some of the statistical data generated not being useful to the user. |
-
All scores should be in percentage terms. (0 ~ 100)
| The general rule for the file format is to ensure all entries in the file are as compact to the top left as possible; the entries should form a rectangular shape on the top left corner of the excel sheet. The rectangle should have no empty entries while all cells outside the rectangle are empty entries. |
The statistics report generated uses weighted average scores across the different subjects to perform analysis. All scores carry equal weight. The statistics generated allow you to see some of the common descriptive statistics and their relative distributions both in terms of frequency and percentile terms.
The screenshot below illustrates a sample data set that fulfills all of the above specifications.
Contributions to the Developer Guide
Given below are sections I contributed to the Developer Guide. They showcase my ability to write technical documentation. As with the User Guide, I will only showcase one example from each feature to demonstrate the depth of my technical capacities and my contributions. The full document can be seen here: Developer Guide |
The following is an example of Adding Notes:
Add Note Command
Implementation
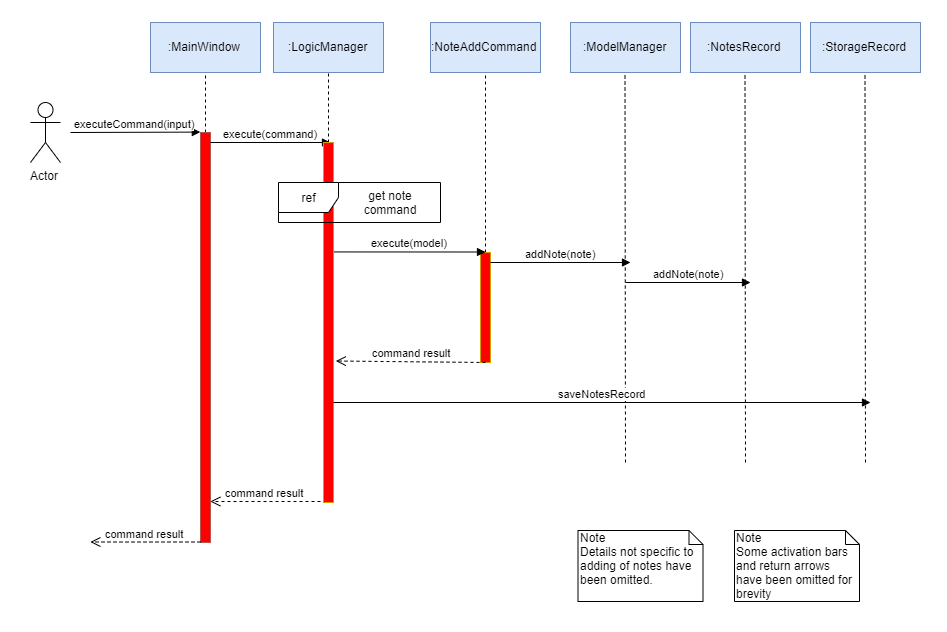
The following is a detailed explanation of the operations NoteAddCommand performs.
-
The
NoteAddCommand#execute(Model model)method is executed and it validates that theNoteobject passed from the parser using command input is valid. -
The method
Model#addNote(Note note)will then be called to add the specified note to theNotesRecord. TheNoteadded is validated for uniqueness byNote#isSameNote(Note note). -
If successful, a success message will be generated and a new
CommandResultwill be returned with the generated success message. Otherwise, an error message showing proper note command syntax is thrown asCommandException. -
If the command syntax was valid and
Notewas added to theNotesRecord,LogicManagercallsStorage#saveNotesRecord(ReadOnlyNotesRecord notesRecord)which saves theNotesRecordin JSON format after serializing it using theJsonSerializableNotesRecord.
The ReadOnlyNotesRecord hides the implementation of the NotesRecord from the other layers of the software.
|
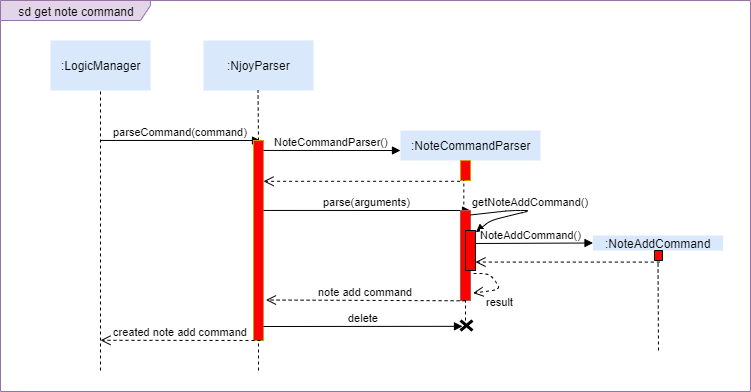
The following is a sample sequence diagram of the NoteAddCommand. Other commands under the notes feature follow a similar program flow; their diagrams have been omitted for brevity.
The following is an example of Statistics Generation:
Generating Statistics
The statistics feature allows users of Njoy to generate statistics reports using external files as input data.
Current File Compatibilities: Excel(.xlsx)
A generic data parser of external files is used to generate HashMap of student’s data as specified by the input file. This processed data is passed to a Statistics Model which performs statistical analysis before passing back to the UI for rendering.
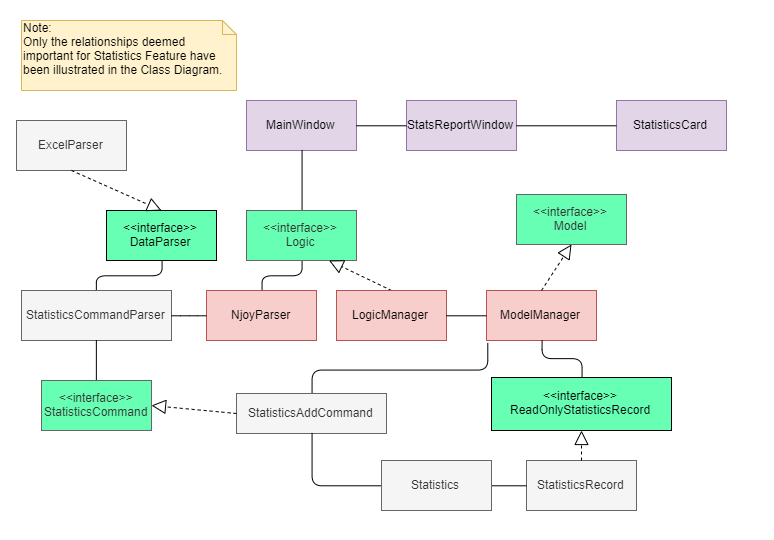
The following is an example usage scenario where the Actor/User asks Njoy for a statistics report.
-
Actor/User inputs a statistics command with data path as specified in user guide.
MainWindow#executeCommand(String commandText)passes the user input to theLogicManager. -
The logic manager passes received input into its main parser which recognises this is a command for statistics. It passes the input to the
StatisticsCommandParserfor retrieving data from the external file. All data file parsers implements theDataParserinterface. -
Suppose the data was successfully retrieved,
Statisticsobject is generated for data processing and passed intoStatisticsAddCommand. -
Execution of this command results in the processed data being passed to the
ModelManagerusingStatisticsAddCommand#execute. -
The success result of the Statistics command is shown on the GUI and the execution call has returned to
MainWindow#executeCommand(String commandText). It recognises the command was a valid Statistics command and opens a new window to show the processed data.
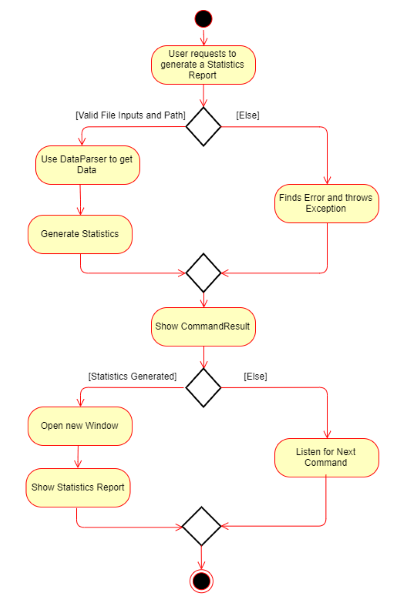
If the input file is not formatted as specified in the user guide, a ParseException would be thrown to show error message as the result. No new window is opened. The diagram below illustrates possible program control flows.
|
Design Considerations
Aspect: Rendering UI
-
Alternative 1 (current choice): Opens a new window for the report generated.
-
Pros: More space to work with, able to generate more comprehensive report that is easier to view.
-
Cons: Data widgets are no longer stateful, they are newly created every time a new report is requested.
-
-
Alternative 2: Render data for current state of the model on the user interface.
-
Pros: Stateful, no need to recreate the widget every time there is new input data.
-
Cons: Lack of space, hard to render other UI elements such as the timetable.
-